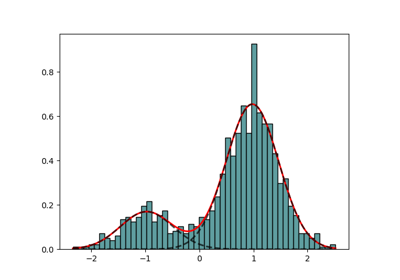
Gaussian Mixture model
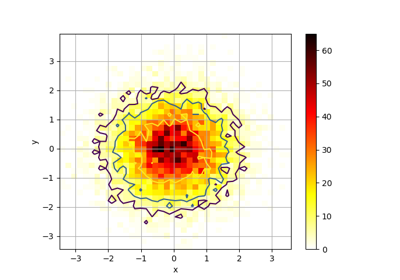
Hist2d using Pandas dataframe as input
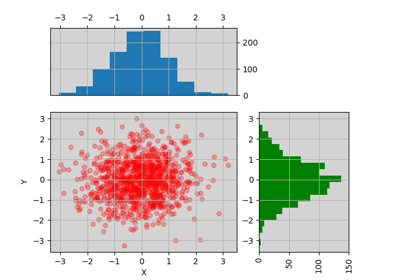
Scatter plot and histogram
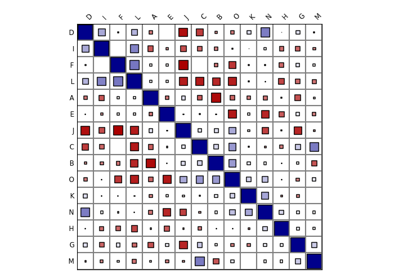
Corrplot example
Gallery generated by Sphinx-Gallery