Note
Click here to download the full example code
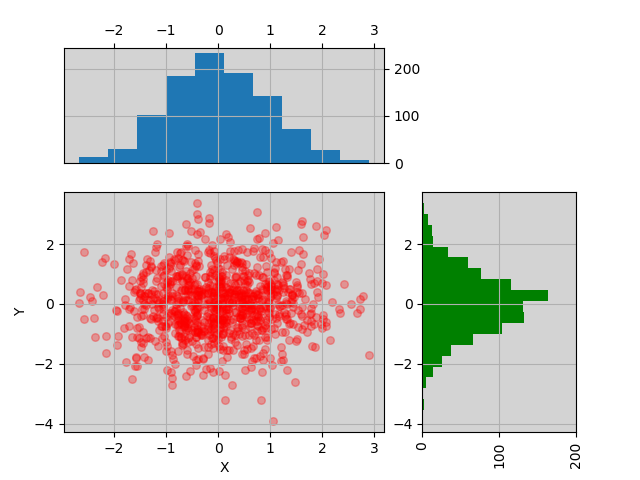
1.3. Scatter plot and histogram
import pylab
from biokit import ScatterHist
import pandas as pd

# input can be a 2-column matrix or a dataframe with 2 columns
X = pylab.randn(1000)
Y = pylab.randn(1000)

df = pd.DataFrame({'X':X, 'Y':Y})

sh = ScatterHist(df)
you can tune the scatter plot and histogram with valid optional arguments expected by the pylab functions. Check the pylab.hist and pylab.scatter helps for details.
_ = sh.plot(kargs_scatter={'c':'r', 's':30, 'alpha':.3},
                   kargs_histy={'color':'g', 'bins':20})
Total running time of the script: ( 0 minutes 0.125 seconds)